THE WHY / UNDERSTAND THE AUCTION
Understand
the auction.
I don’t predict.
I wait for failure.
An SFP means something to me because of the attempt that failed, the response that followed and what happens when that area is tested again. This is the thinking behind the setup: how I read control, why I care about the retest and how that becomes a trade.
01 / THE BEHAVIOUR BEHIND THE CANDLES
Read the sequence.
Understand the behaviour.
This is how I see the market. Candles are the words. Together they form a sequence, like a sentence. Auction logic is the grammar I use to read how those words fit together. A candle gets its meaning from its location and the response around it.
Every completed trade has a buyer and a seller. The difference is how urgently participants want to transact and what liquidity is available. Buying can consume the offers at one price and transact higher. Selling can consume bids and transact lower. Orders can also be added or withdrawn.
I watch which attempts make progress and which fail. If pushes higher keep failing and rebounds cannot recover lost ground, I read sellers as having the upper hand on that timeframe. Control is something I keep assessing through the response.
A local decline can sit inside a larger uptrend. I choose the timeframe and relevant structure so I know which move I am trading. The same auction questions apply to longs, shorts and ranges; liquidity, volatility and trading costs still differ.
Price moves as participants respond to each other. I read the resulting behaviour as acceptance, rejection or unresolved balance. The sequence gives me something to assess while the next response is still unknown. That is where my probabilistic thinking starts.
02 / STRUCTURE AND UNCERTAINTY
Structured behaviour.
Uncertain outcomes.
When I say “price is probabilistic, not random”, I mean that uncertainty does not make the auction meaningless. There is behaviour to assess, but no single outcome I can know in advance. In statistical language, randomness and probability can coexist. My distinction is between uncertainty and having no useful context.
The grammar does not write the next candle.
A failed push and a rejected return give me information about how price is responding. I can form an expectation from that sequence, while accepting that the next attempt may behave differently. “Uncertain” does not mean I assume every outcome has an equal chance. Equally, recognising the pattern does not give me a known win rate. My record after costs has to support the way I trade it.
I react to the reaction.
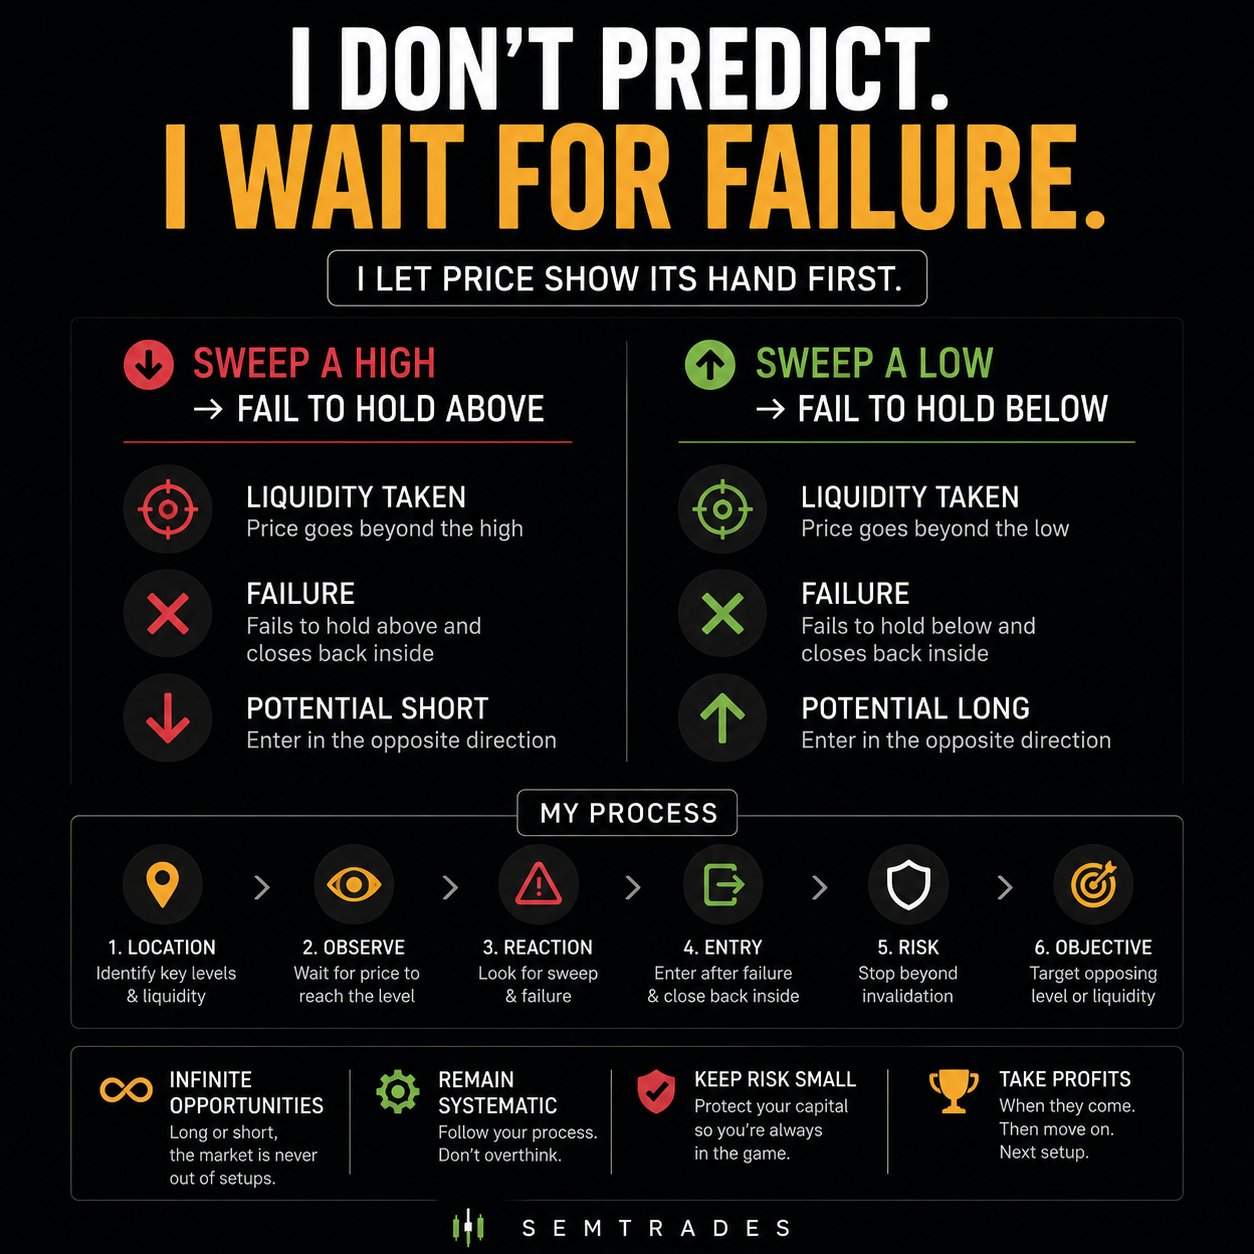
I mark possible scenarios before price arrives. A swept high alone does not make me short: I wait for failure and a response that qualifies. If price instead accepts above, that short idea is gone. If the response stays unclear, I wait. I still have an expectation about what could follow; the decision stays conditional on what the market actually does.
I do not need to call the entire move. I need a qualified response, somewhere to be wrong and room towards the next area where the other side may respond. The sequence helps me make that decision. Risk management handles the possibility that it fails.
03 / WHY I CARE ABOUT A FAILED ATTEMPT
The sweep is an attempt.
The failure changes the read.
Start with a meaningful high.
A prior high gives me a place to observe. Above it, buy-stops can trigger and breakout buyers may join. Price trading there tells me the auction has explored higher prices. It has not yet told me whether those prices can hold.
If the push holds, the auction can continue.
Price stays above, builds structure and finds support on the return. That is acceptance in my reading. The higher prices are sustaining activity. My failed-high short idea has no reason to be there.
If the push fails, the information changes.
Price gets above the high but cannot sustain the move, then comes back inside. The buying that carried the attempt has not kept price there. Some recent longs may exit and fresh sellers may participate. Those are possible contributors; the visible evidence is the failure to hold.
Now I have a specific question.
Can buyers recover that rejected area, or does the return fail too? The wick pocket marks the area explored and rejected. That is why I pay attention there again. A wick by itself gives me less information than the attempt, failure and subsequent response together.
04 / THE RETURN TESTS CONTROL
Why the retest
matters to me.
After a failed push higher, the return gives buyers another opportunity to recover the rejected area. I want to see whether that recovery can hold, or whether the area continues to act as resistance. The response tests the idea I formed from the first failure.
Price comes back towards the pocket, cannot establish itself through it and turns away. I read that as the failed-high idea still being supported. Buyers had another opportunity to regain the area and could not keep it. That response can qualify my short.
Price gets through the area, builds above it and holds it as support. The response is now contradicting the rejection I wanted to trade. I reassess instead of continuing to call the original wick resistance. My predefined stop still governs the open trade.
Price overlaps the area without a clear hold or failure. A touch is not enough to decide who has the upper hand. I wait or pass. I do not need to turn every return into an entry.
Why this location can be tradable.
The failed extreme gives me a place to define invalidation. A response near the pocket can put entry reasonably close to that point, while an opposing level provides an objective farther away. If the distance, costs or context do not make sense, I pass. I never move the stop inside the idea’s invalidation to manufacture attractive R/R.
Why I look towards the next opposing area.
If the return fails and price moves away, I look across the structure for where the other side may respond: prior support, a swing low or relevant liquidity. That is the next area I want to manage around: the next contest between buyers and sellers. Control can change there, or even before price arrives. It is a structural objective, not a promise that price must travel there.
For a long, a push below a low fails. Price reclaims. The return tests whether the reclaimed area holds as support. A hold supports the long idea; acceptance back below contradicts it. Entry from the response, invalidation beyond the failed low, objective at opposing structure. The same decision process, in the other direction.
A retest adds a new observation, not a guaranteed outcome or a measured increase in win rate. Sometimes price leaves without returning. A first hold or later retest changes the entry choice; the need for a meaningful failure, a response and defined risk stays. I do not need to participate in every move.
05 / THE ORIGIN OF THE MOVE
Where did the
move begin?
I mark the high that launched a meaningful sell-off, or the low that launched a rally. It matters more when price moved away decisively and broke a relevant prior swing. Then I wait for the return.
A level on the 3m chart can help with a local entry. It does not replace the 4H map or justify a distant target on its own. I mark the broader level first, then refine the reaction.
I do not mark an origin and blindly trade it. I wait for price to come back and show its hand. Overlapping price can mean I still have no answer.
A prior sell-off origin can be a target for my long. If price later fails there, a short is a separate decision with fresh evidence and its own risk plan.
THE EVIDENCE / AFTER COSTS
A nice chart is not enough.
What did I actually make?
Waiting for failure gives me a conditional entry, a place where the idea is wrong and a structural objective. That makes the decision measurable. It does not make every trade a winner.
ILLUSTRATIVE MATH / NOT MY RESULTS
What has to add up?
1R is the planned loss at the original stop. This model assumes an average losing trade of 1R before costs. Change the assumptions and see how a positive result can disappear.
40% × 2R − 60% × 1R − 0.10R
Across 100 hypothetical trades: 40 winners × 2R − 60 losses × 1R − 10R in costs = +10R.
Break-even win rate with these assumptions: 36.7%.
This is arithmetic, not a forecast or a return on capital. Fees, funding, slippage, partial exits and actual losses change the numbers. Real trade sequences also produce losing streaks and drawdowns.
The explanation can make sense and still lose money. Only a complete record after costs can tell me whether my execution works. This site does not publish verified performance results; these numbers are hypothetical.