THE CONTEXT / ADD THE NUANCE
Same setup.
Better decisions.
Not every swept high or low
means the same thing.
What got swept? Which timeframe owns it? Am I trading a local rotation or a structural change? The shape may look familiar. The job of the trade can be very different.
01 / OUTSIDE IN
15m tells the story.
3m shows the proof.
I start with the 4H map. Then I move closer. A 3m reclaim can be a local long inside a 4H downtrend. It does not turn the entire market bullish.
One daytrading example. My core combination is 4H context, 15m structure and 3m execution. The 1H can help bridge a broad 4H level and the local reaction; it is optional, not an extra confirmation to collect. The underlying process is not tied to these timeframes.
4H · Context
Which story am I trading inside?
In this daytrading example, 4H gives me trend, range and defining highs and lows. I mark the structure that gives a local move its weight. A 3m long can exist inside a 4H downtrend; that does not make it a higher-timeframe reversal.
1H · Reaction
How is price reacting inside the 4H map?
The 1H is an optional bridge between my 4H map and the local setup. I can use it to inspect acceptance or rejection at a broader level and identify intermediate swings. It is useful when 4H feels too broad and 15m too noisy. It is not an extra entry signal or a mandatory fourth confirmation.
15m · Structure
Where is the local decision?
I map the range, the liquidity event, the reclaim or loss of a level, and where price is trying to accept. Local liquidity may offer a local reaction. A structural extreme can matter much more.
3m · Execution
Is the reclaimed area actually holding?
I look for the close back through the level and a pullback that holds. The first hold can be enough proof; waiting for every local high or low to break may leave too little reward for the risk.
02 / MY ANNOTATED CHARTS
Keep the level
in its context.
One decision at a time. Choose a chart below, use the arrows or swipe through the sequence. Each example keeps its explanation beside it. Historical charts, not current setups.
01 / 06 Local or structural SFP
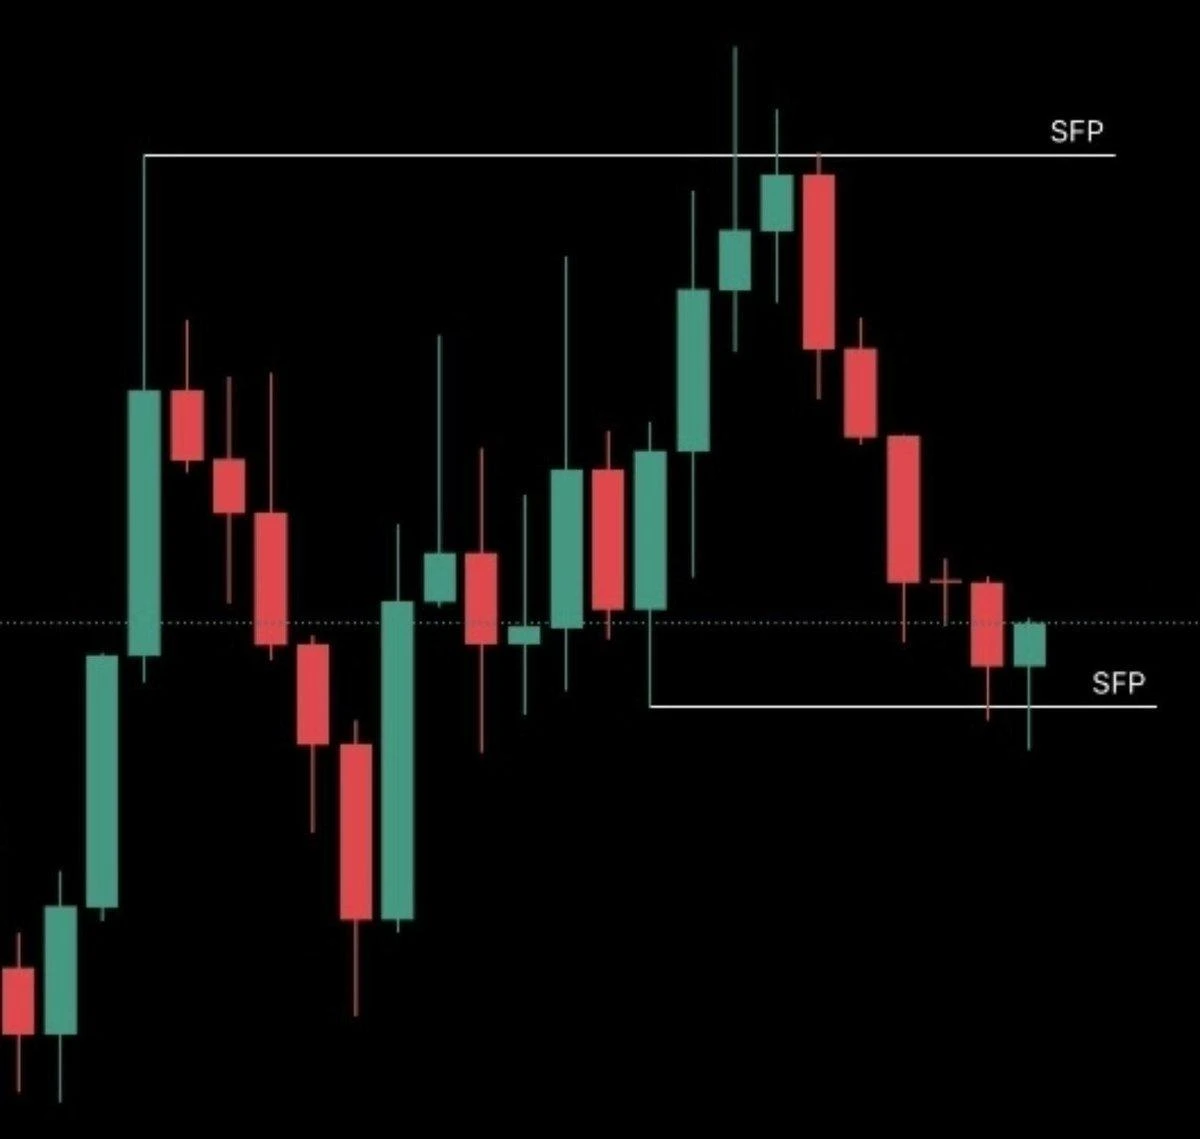
Local or structural SFP
The question is not only whether price swept a level. What did it sweep, and which timeframe owns that level? A local SFP may give a small reaction. It does not automatically carry the same significance as a failure at a major structural extreme.
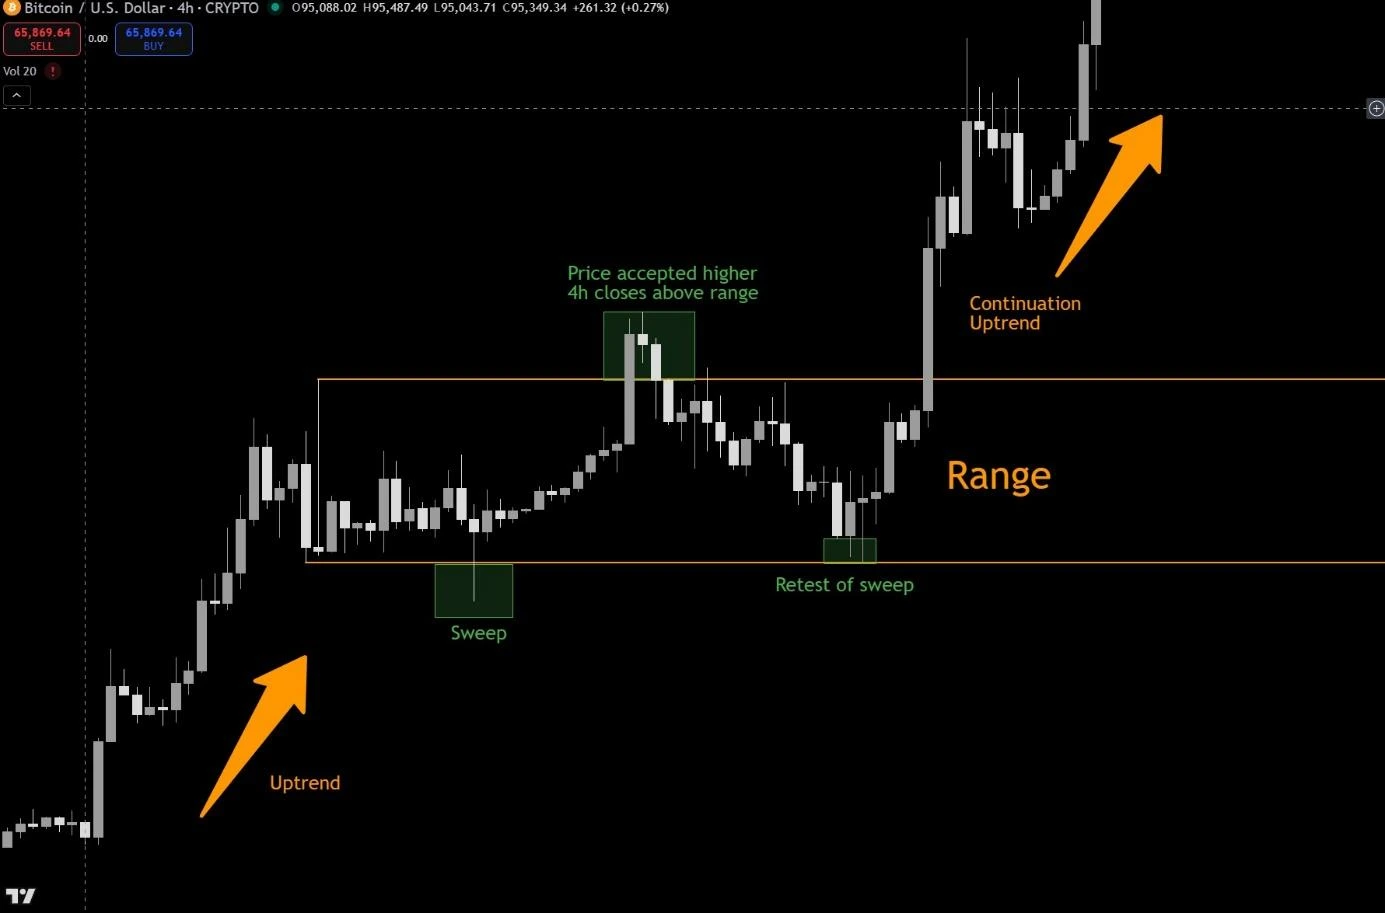
4H: bullish context
Invert the bearish logic. The first reclaim can offer a local long into the range. Acceptance above it adds higher-timeframe information. A local short back inside can still exist within that bullish context. The later defence of the swept low is a separate decision.
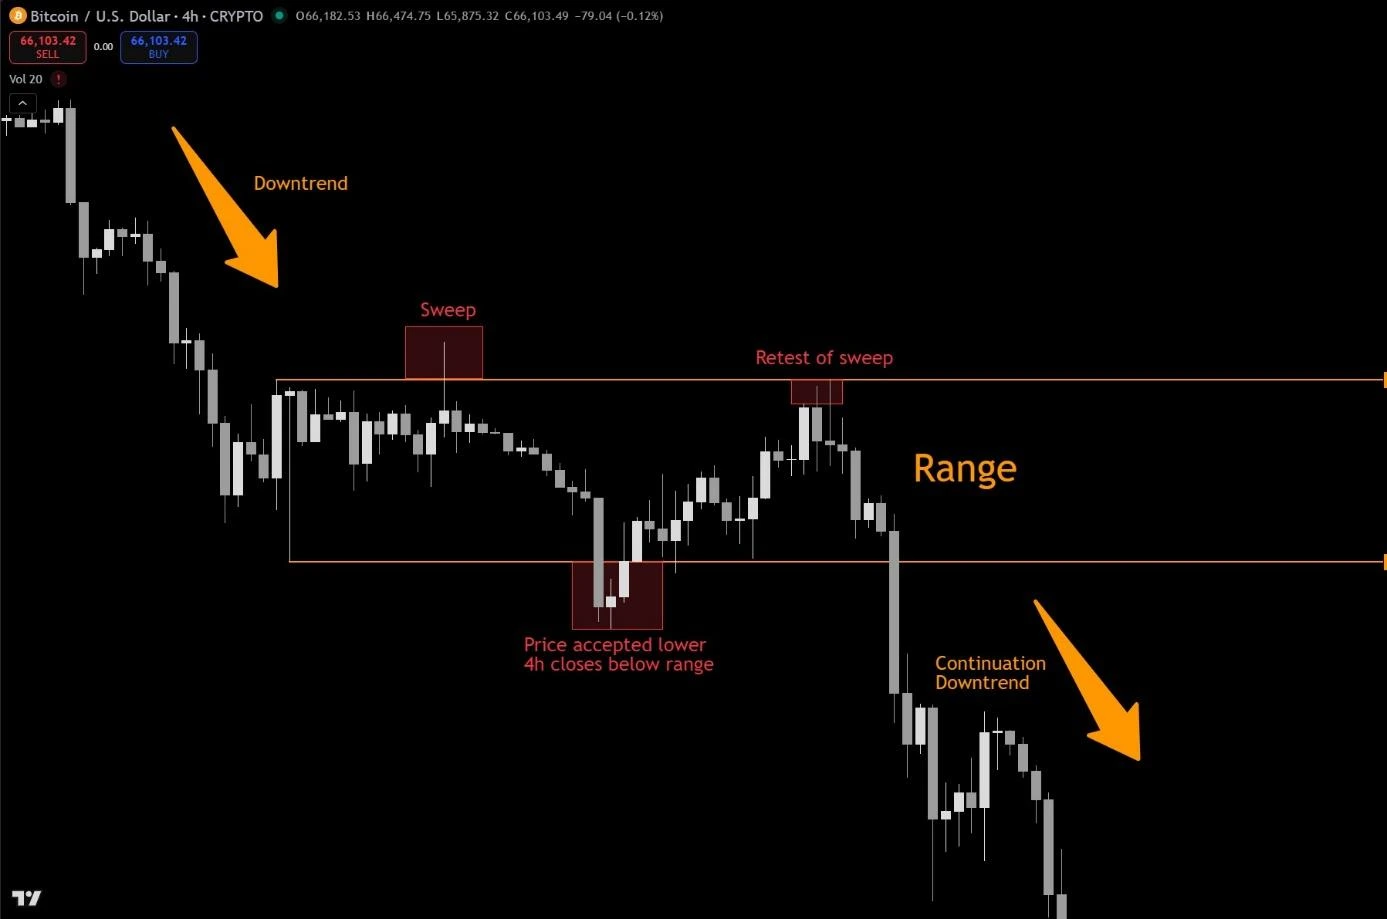
4H: bearish context
The first failed high can offer a local short into the range. Acceptance below the range changes the 4H story. A later reclaim may still offer a local countertrend long. The subsequent failure at the swept high carries more structural weight. These are separate decisions, not one guaranteed sequence.
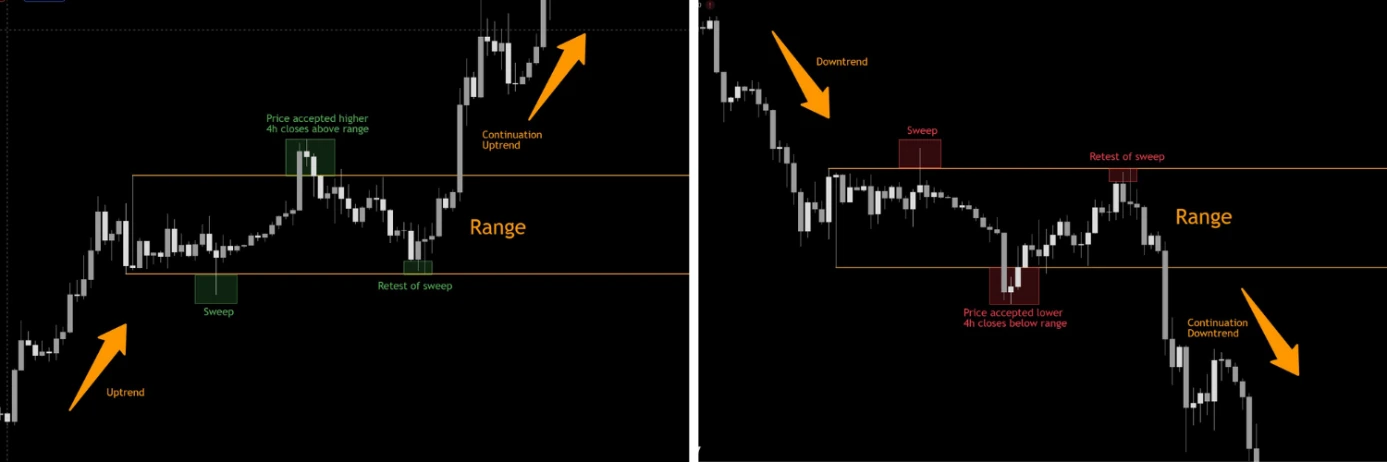
Long – Short
Highs become lows. Resistance becomes support. Failed upside becomes failed downside. I use the same auction logic in both directions; context, execution and risk still decide whether a particular trade is worth taking.
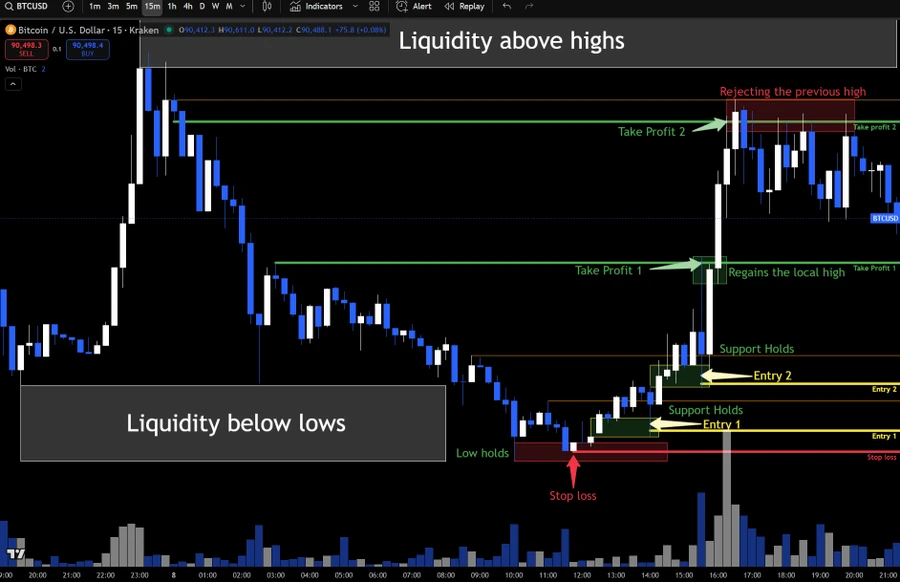
Long: the first hold
This 15m chart maps the local long. My execution model looks for 3m proof around that area. Entry 1 is the first hold of the reclaim. Entry 2 is the later retest: more evidence, but potentially less room to the target. TP1 is the first logical resistance; TP2 is the broader opposing liquidity.
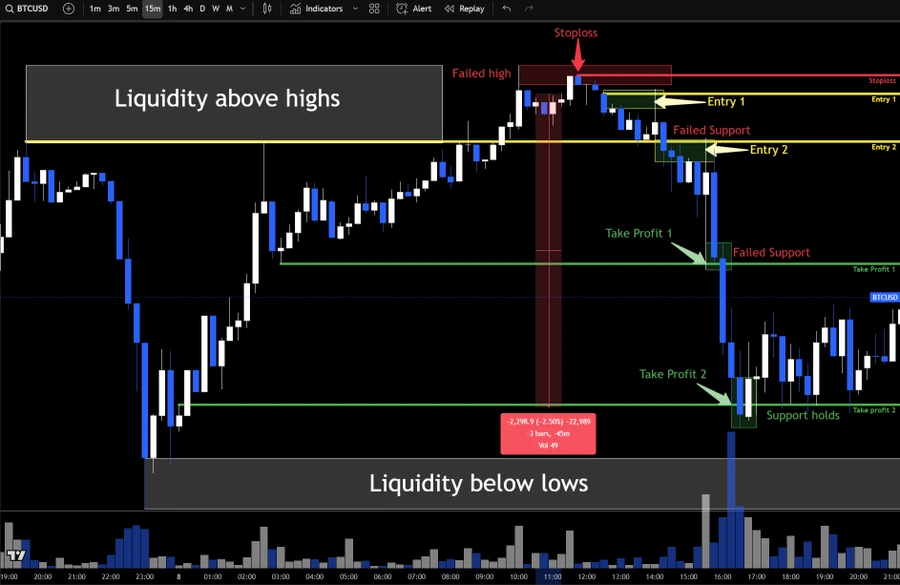
Short: the same logic
The same structure, inverted. I want price back below the high, then resistance to hold. The stop belongs beyond the failed extreme. Local support is the first place to reduce; deeper liquidity is a separate objective that needs enough room and supporting context.
03 / ETHEREUM IN PRACTICE
Two shorts.
One rejection area.
This 1H Ethereum chart brings the pieces together. A downtrend, a small local range and a failed push above its high. I am interested in the response at that area, not just the fact that price touched it.
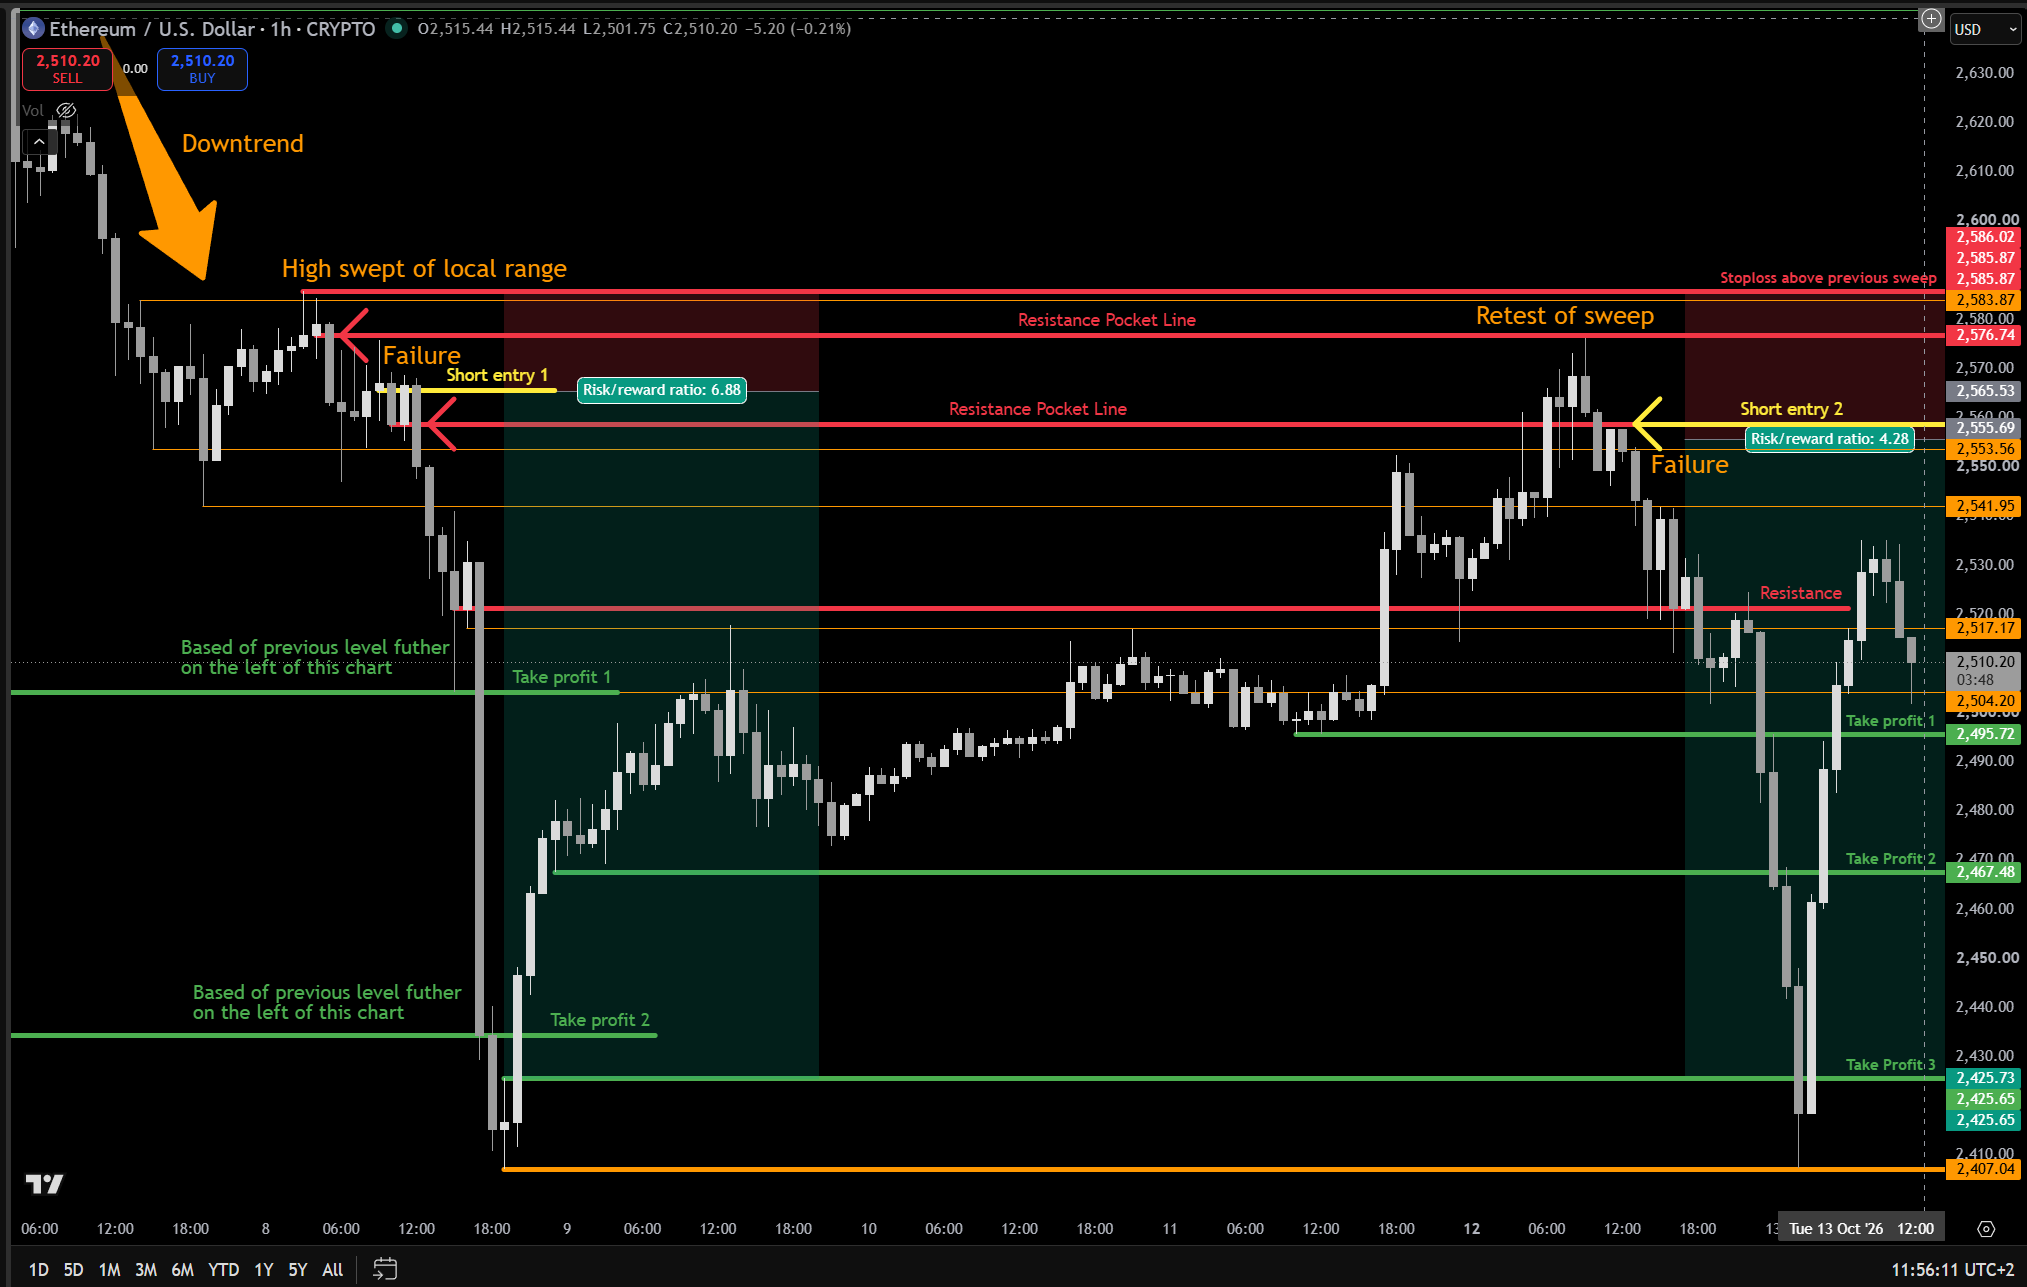
- 01 / LOCATION
A local high inside a downtrend.
Price pauses and forms a small range. It pushes just beyond that range high, then fails to stay there. The sweep is small, but the question is the same: can the move hold? The downtrend gives context; the failed attempt gives me something to work with.
- 02 / SHORT ENTRY 1
The return fails too.
The failed push leaves a rejection area: the sweep pocket. Price returns towards it and cannot hold higher. Short entry 1 is marked after that response. The stop sits beyond the swept high. TP1 and TP2 come from levels farther left, outside this screenshot, that had mattered before.
- 03 / SHORT ENTRY 2
Same area. A fresh decision.
After the first decline, price works back towards the original pocket. This return also sweeps the local failure high involved in entry 1. The renewed failure gives the second short idea. I reassess the reaction, invalidation, room to target and available risk. The first short working does not validate the next one.
- 04 / OBJECTIVES
Read what the move left behind.
For short 2, the marked targets come from liquidity references in the recovery after the first low. Once price loses the area around 2,517, the return fails at resistance and the downside accelerates. That is later information, not something the entry could guarantee. TP1, TP2 and TP3 belong to the structure rather than an arbitrary R number.
Find the level. Watch the sweep fail. Read the return. Define where the idea is wrong and what is on the other side. A second entry needs the same work, within the same risk boundaries.
THE SAME FRAMEWORK / LONG AND SHORT
Flip the direction.
Keep the logic.
I inverted the short chart and flipped the candle colours and support/resistance markings. Read it as a long setup: a sweep below a low, a reclaim and a hold on the return. My framework is long/short agnostic. I am reading the same behaviour from the other side.
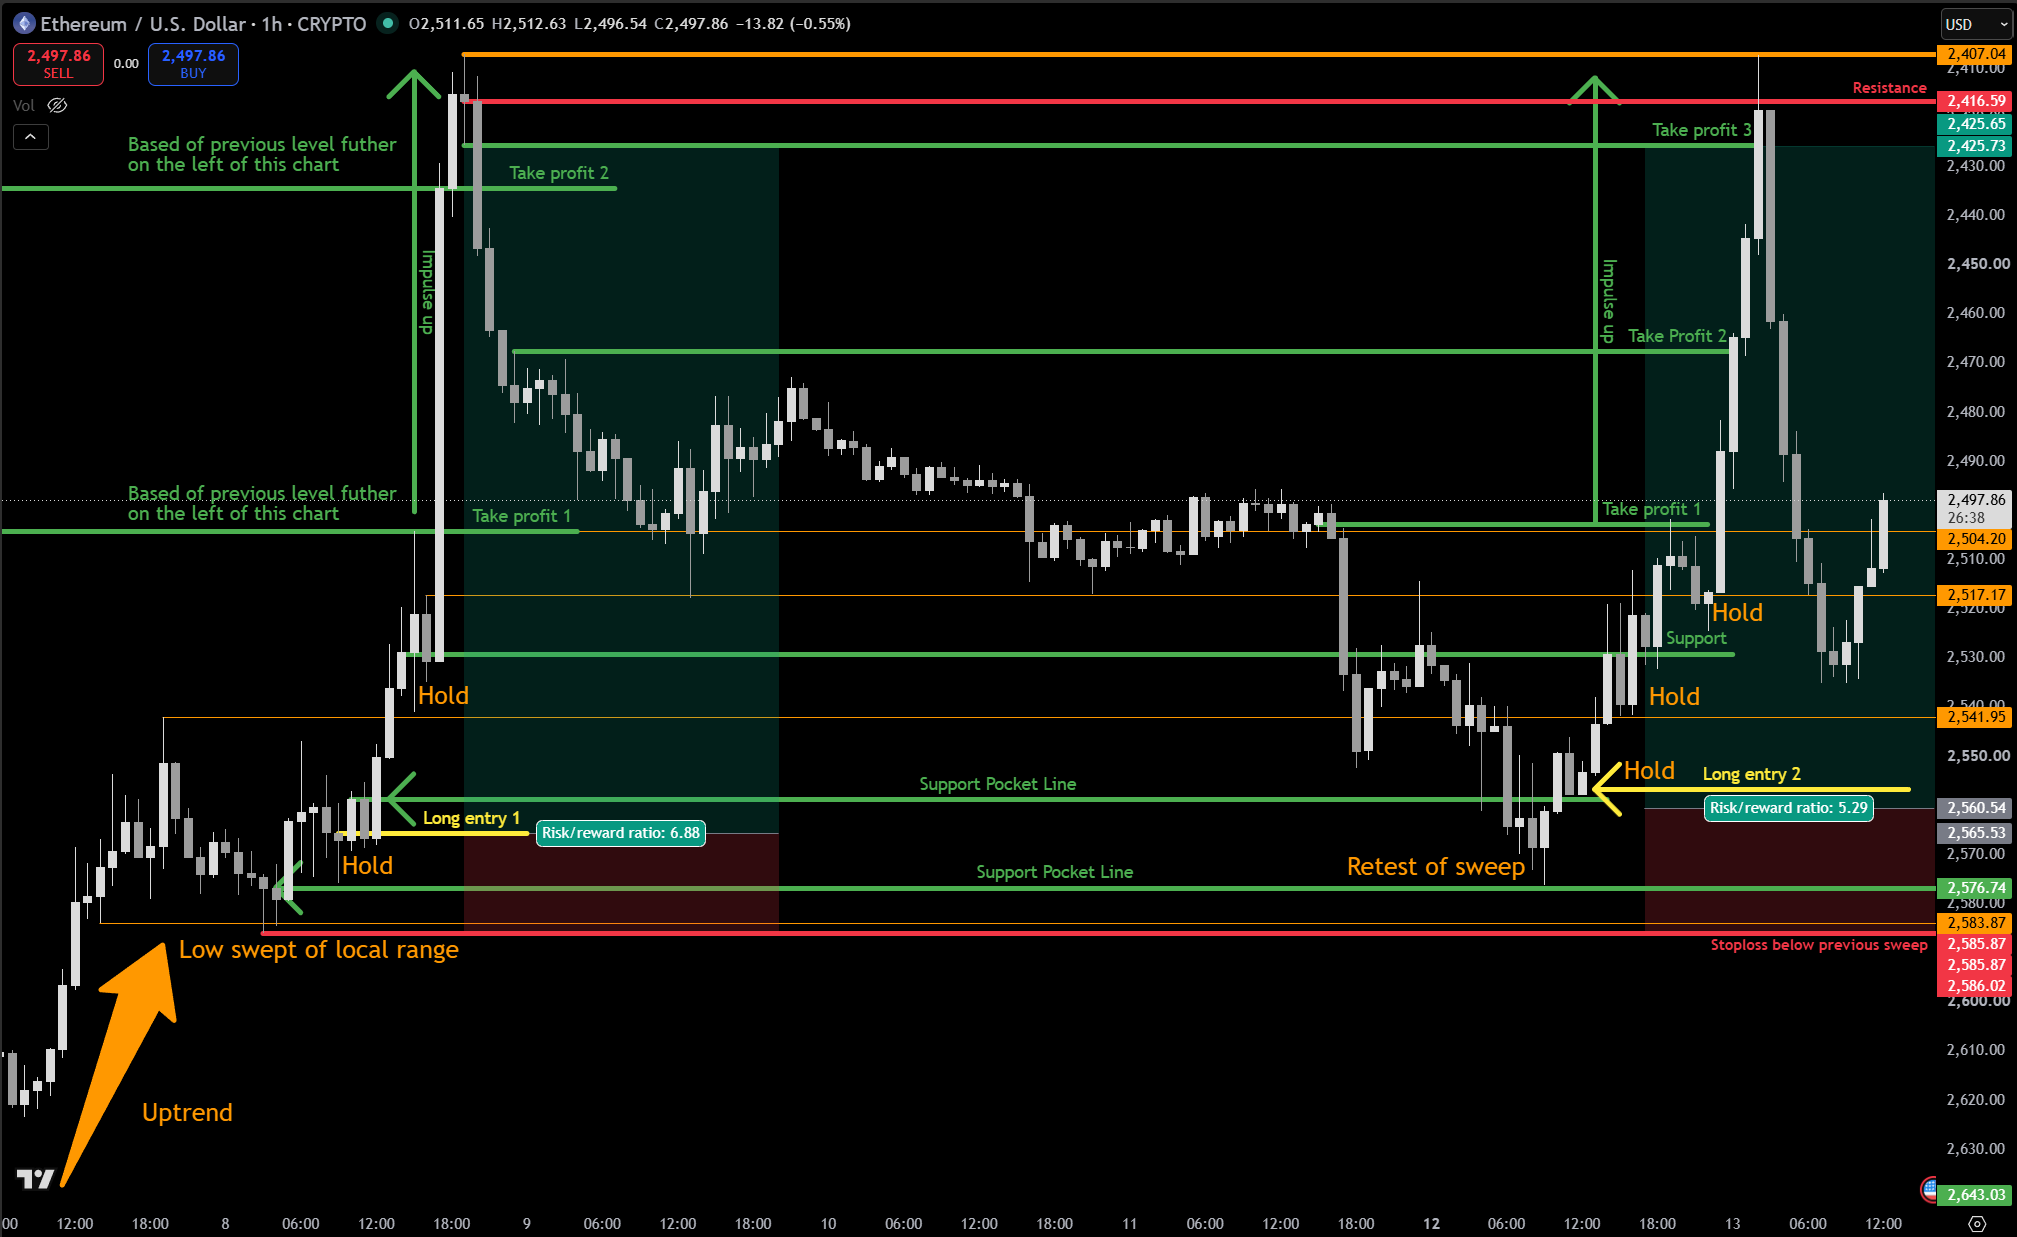
Read the long sequence.
A low is swept. Price reclaims it. The first return holds as support. Later, a second retest comes back to the original pocket and also sweeps a more recent local low. I look for the response, place invalidation beneath the failed low and read the opposing structure for objectives.
One framework. Both directions.
An uptrend, downtrend or range changes the context of the trade. I still ask where price is, what it tried to do and whether that attempt held or failed. The same questions organise my long and short decisions. The timeframe tells me which part of that movement I am trading.
THE BOUNDARY / RULES AND JUDGEMENT
Keep the rules.
Read the situation.
This is a discretionary framework. I use judgement inside a procedure; I do not invent a new reason to trade every time a candle moves. Separating the two makes the review much more useful.
WHAT STAYS FIXED
The conditions for a decision.
- A level gives me a location to watch, not an automatic order.
- I need failure and a response back inside before considering the opposite direction.
- I define invalidation and a logical objective before sizing the position.
- My planned risk stays within my budget. I do not widen the stop to rescue an idea.
- I record the decision, including losses and passes.
WHAT I ASSESS
The quality of this opportunity.
- Is this a local reaction or a meaningful structural level?
- Does the higher timeframe support the objective I have in mind?
- Is the first hold clear enough, or do I need a later retest?
- Does that later entry still leave room to the same target?
- Can I give this trade the attention it needs?
For example: the same rejection can leave a useful entry on the first hold and a poor one after price has already travelled towards the target. The setup did not change. The opportunity did. If I cannot explain the difference before entering, “discretion” is doing too much work.
04 / AFTER THE ENTRY
Manage the idea.
Not the feeling.
More confirmation is not free. A later entry can leave less room to the same target. If the room is gone, I pass instead of squeezing the stop to manufacture a nice number.
The first hold is the first proof. A later retest can be clearer, but I reassess price, invalidation and reward. I do not chase a move because I missed entry 1.
First opposing structure is my first place to reduce. A broader target needs context and room. Acceptance on the wrong side of my failed level can invalidate the idea before the final stop.
If new structure lets me add to a winner, I recalculate the combined risk at the revised stops, including costs. I never add another 1% with every click or widen a stop to rescue a trade.
BTC and ETH can move together. Two positions are not necessarily two independent risks.