THE SETUP / START HERE
Trade the
failure.
Price takes a high or a low.
Then I watch what happens next.
A sweep alone tells me too little. I want the move to fail, price to close back inside and the reclaimed area to hold. That gives me an entry to assess and somewhere clear to be wrong.
01 / READ THE CANDLE FIRST
Four prices.
One piece of the story.
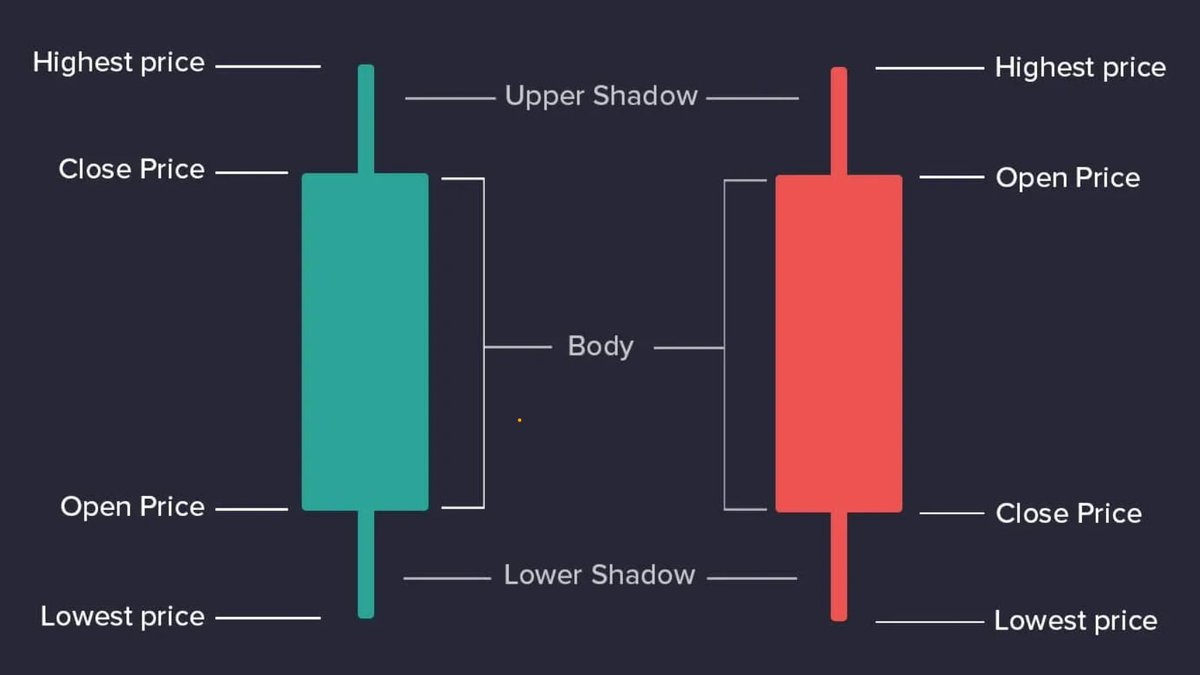
A candle shows what price did during one period. It does not tell me what the next candle will do. I keep my charts mostly free of indicators so I can focus on the same information each time: the candles, the structure and the response at a level. That is my preference, not proof of an edge.
The body: open to close.
The body connects the opening and closing prices. A green body means the close was higher than the open; a red body means it was lower.
The wicks: the full range.
The tips mark the highest and lowest traded prices. An upper wick means price traded higher than the body before coming back. A lower wick means it traded lower.
The close: where it finished.
A wick beyond a prior high or low can show a test of that level. Where the candle closes, and how price responds next, tell me whether that test is becoming a failure.
02 / ONE OF MY ACTUAL TRADES
A push higher.
A failure. A short.
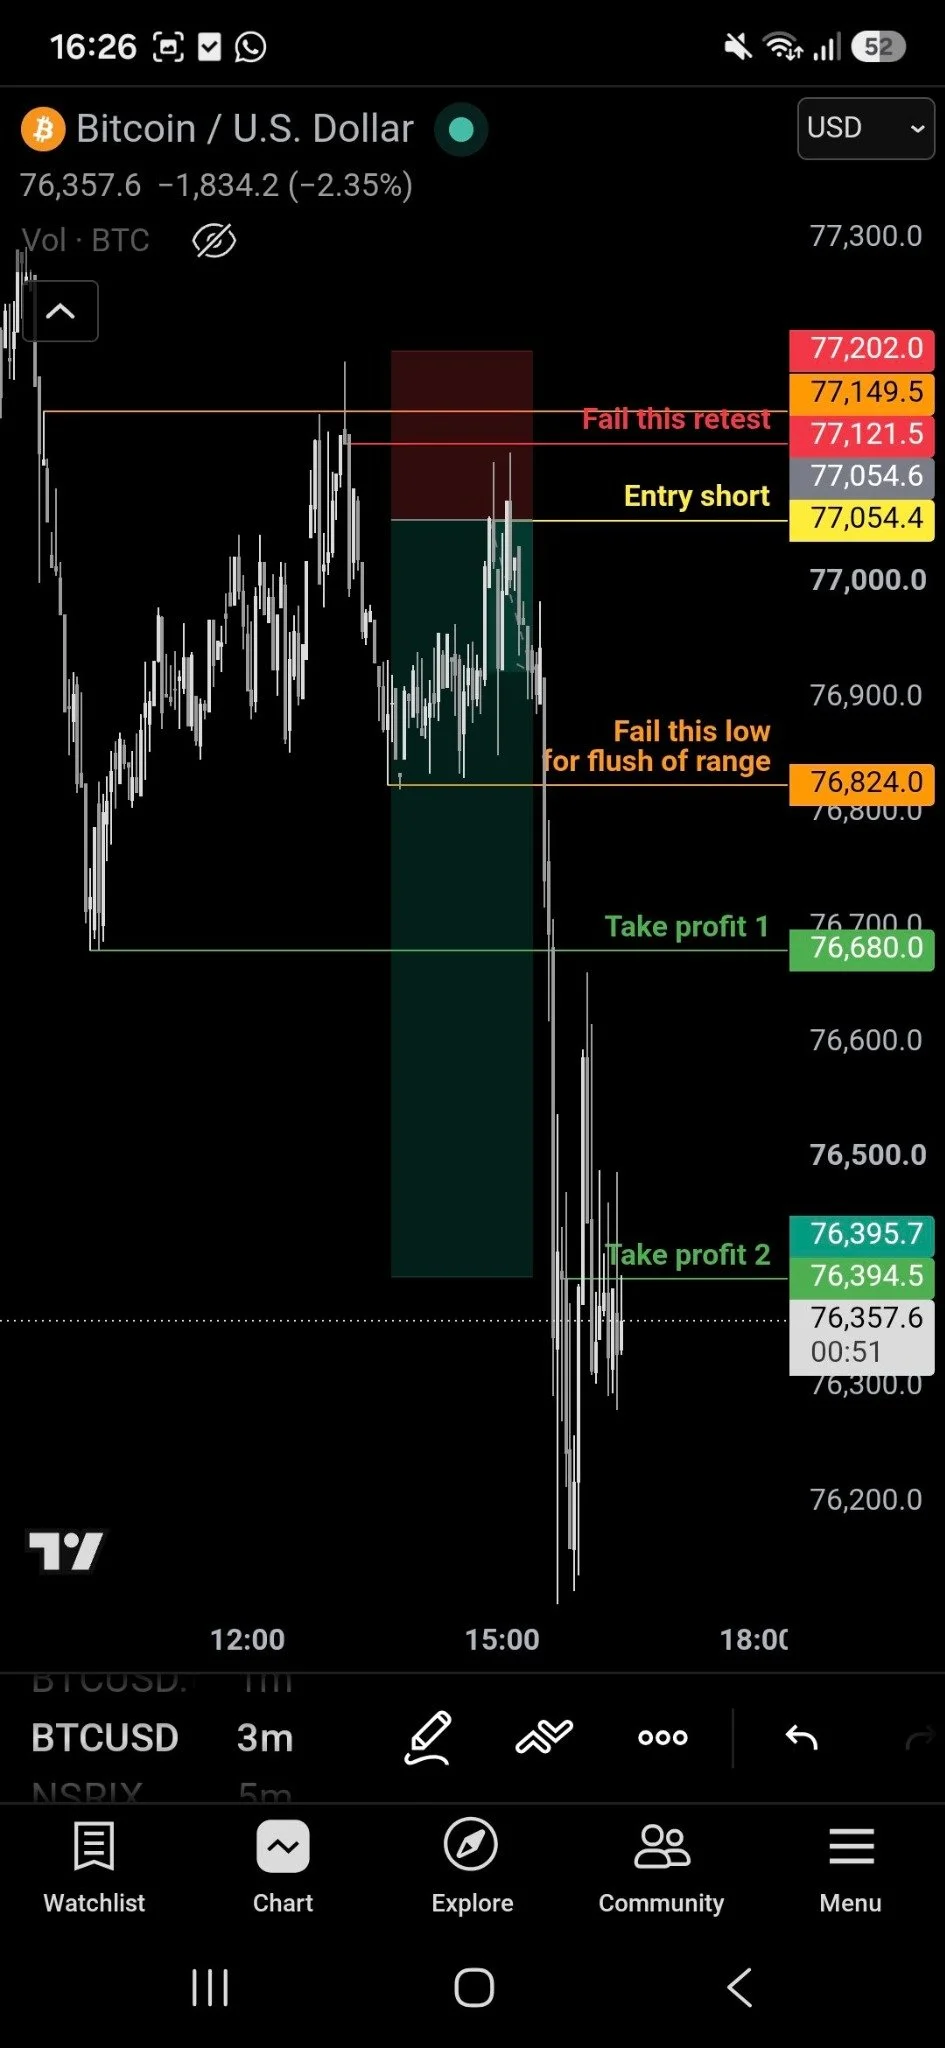
One of my favourite Bitcoin setups, called live on stream. Start here: price tried higher, could not stay there, then failed again on the return. I traded that failure toward the lows.
 Open original chart
- 01
Start with the downtrend.
A local range forms. Price sweeps its high into an untested pocket left by the earlier sell-off. Context first — not just any high in a choppy range.
- 02
Wait for the failed retest.
The push higher fails. Price returns into the upper-wick area, cannot stay above it and turns back down. I look for that failed retest, not an entry just because price touched a wick. The sweep alone is not the trade.
- 03
Know where I am wrong.
Stop above the failed extreme. First target below the local low; next target deeper into the move. Position size follows the stop.
Buyers failed to hold higher in a downtrend. The retest gives me a nearby place to be wrong, with room toward the lows. If price holds above the failed high, my short idea is wrong.
The wick pocket, in plain English.
The price area inside the earlier candle’s upper wick: price traded there, then was pushed back down. In this setup, I want the sweep to revisit an untested area from the earlier sell-off, then watch the retest fail. A wick by itself tells me too little.
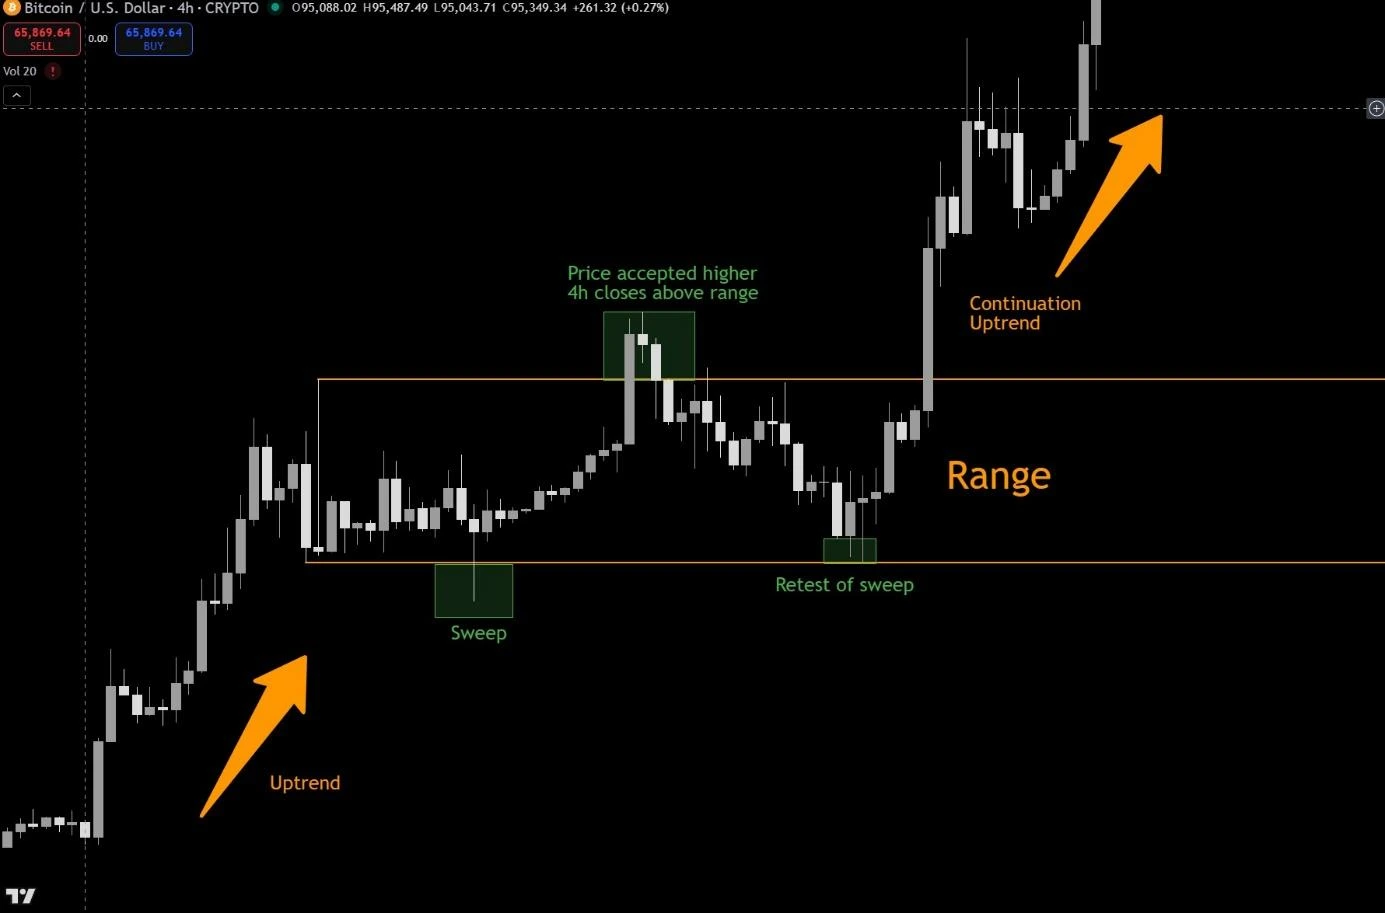
For a long, flip it. Uptrend. Sweep a low. Fail to hold below. Retest and hold. Stop below the failed extreme; objectives above.
03 / THE SAME LOGIC, INVERTED
One setup.
Both directions.
A failed move beyond a meaningful level, followed by evidence that price is back inside. Highs and lows change places. The decision process stays the same.
The long: a supported low.
Sweep the low. Close back above. Watch the first pullback hold. Stop beyond the failed low; objective at opposing resistance or liquidity.
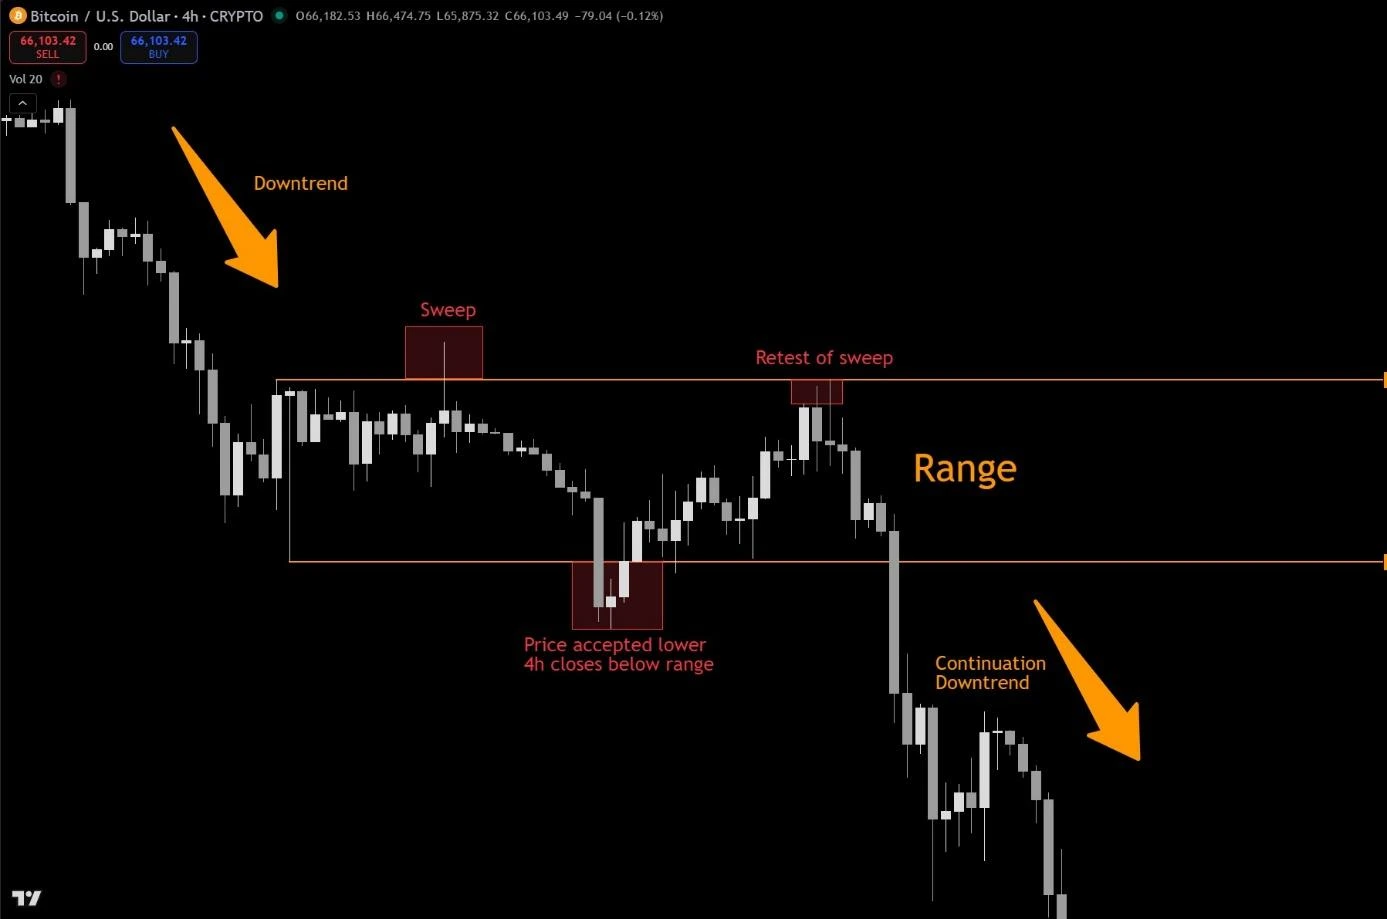
The short: a failed high.
Sweep the high. Close back below. Watch the retest fail. Stop beyond the failed high; objective at opposing support or liquidity.
WHEN I PASSNo reclaim, no hold, messy structure or too little room to the target. I do not need to force a trade.
The level tells me where. The response tells me if.
My maximum is around 1% per idea, shared across entries. Total planned open risk stays within 1% too.
The first opposing level is TP1. I do not move a target just to make the R/R look better.
Planned risk is not a guaranteed maximum loss. Costs, slippage and liquidation matter.
Ready to read the same market in both directions? Explore my original and inverted Ethereum charts →
04 / WORK THROUGH THE SETUP
Put the process on a chart.
Use the six steps to reveal price gradually.
Try the long, the short and a setup that never qualifies.
Choose a study. Move through the candles, define risk, then compare a win and a loss from the same entry. Prices are invented for learning.
THE SAME FRAMEWORK / THREE DECISIONS
A winner. A loss.
A pass.
A winning chart only shows part of the work. I also want to show a valid idea that loses and a situation I leave alone. Read each decision with the information available at the time, before judging the outcome.
The trade that works.
The level is relevant, the move fails and the entry leaves room to opposing structure. The review still asks whether I followed the plan. A profit can hide poor execution.
What made the entry valid before price moved towards the target?
My annotated example is being prepared.
The idea that fails.
A qualified SFP can still fail. If price reaches invalidation, I take the loss I planned. I then separate normal uncertainty from something I did wrong.
Was this a planned loss, or did I break a rule?
My annotated example is being prepared.
The trade I leave alone.
A sweep alone is not enough. No clear rejection, no sensible invalidation or too little room to the objective can all leave me without a trade.
Which missing condition made doing nothing the right decision?
My annotated example is being prepared.
These are the questions for three forthcoming real chart reviews, not a set of claimed trade results. The existing Bitcoin short above is available to study now.
YOUR FIRST REP
Can you mark it
before the outcome?
On TradingView, mark a sweep, the close back inside, invalidation and a logical objective before looking ahead. This trains recognition. Learning to place and manage a real trade is the next, different skill.